A backend for "submit your application and we'll evaluate it." An applicant submits, the system puts the application in a waiting line, and a worker scores the candidate (in the real version, by calling a large language model) and stores a ranked result. Scoring is slow and rate-limited, so we accept instantly (an HTTP 202 Accepted response: received now, scored later) and process behind the waiting line at whatever rate the workers and the model can sustain.
Why this domain: Mercor is a talent-matching marketplace, so "take in candidate applications, score and rank them with a large language model, serve a leaderboard" maps onto the real business. That is what makes a slow, rate-limited scoring step believable rather than contrived, and it is what justifies the whole waiting-line and back-pressure design.
Honest scope: the scoring is a modeled dependency. Simulated mode waits 1.5 seconds to stand in for the model's response time; real mode does call Claude, but was run only a few times. The deliverable is how the system behaves around that slow step under load, not a real scoring product.
POST /applications
{ "candidate": "alice",
  "payload": "5 years backend, Go and Python" }

202 Accepted
{ "id": "3737...", "status": "pending" }
GET /applications/3737...
{ "status": "scored", "score": 58.68 }

GET /leaderboard
[ { "candidate": "sam",   "score": 91.2 },
  { "candidate": "kira",  "score": 88.0 },
  { "candidate": "alice", "score": 58.7 } ]
POST sends one application and returns immediately; GET reads a single result, or the whole ranked leaderboard. Scores shown are example shapes, not measured output.
Architecture
instant accept, scoring in the backgroundThe cheap step (accept and add to the line) is split from the slow step (scoring), so the front door stays fast while scoring is processed in the background and scaled on its own.
Pieces and how they run
containers on one machine; load generator outsideEverything runs as containers on one machine and one private network; only the load generator sits outside, standing in for real client traffic hitting the public entry point.
Performance overview
one worker, load raised from 2 to 14 requests per second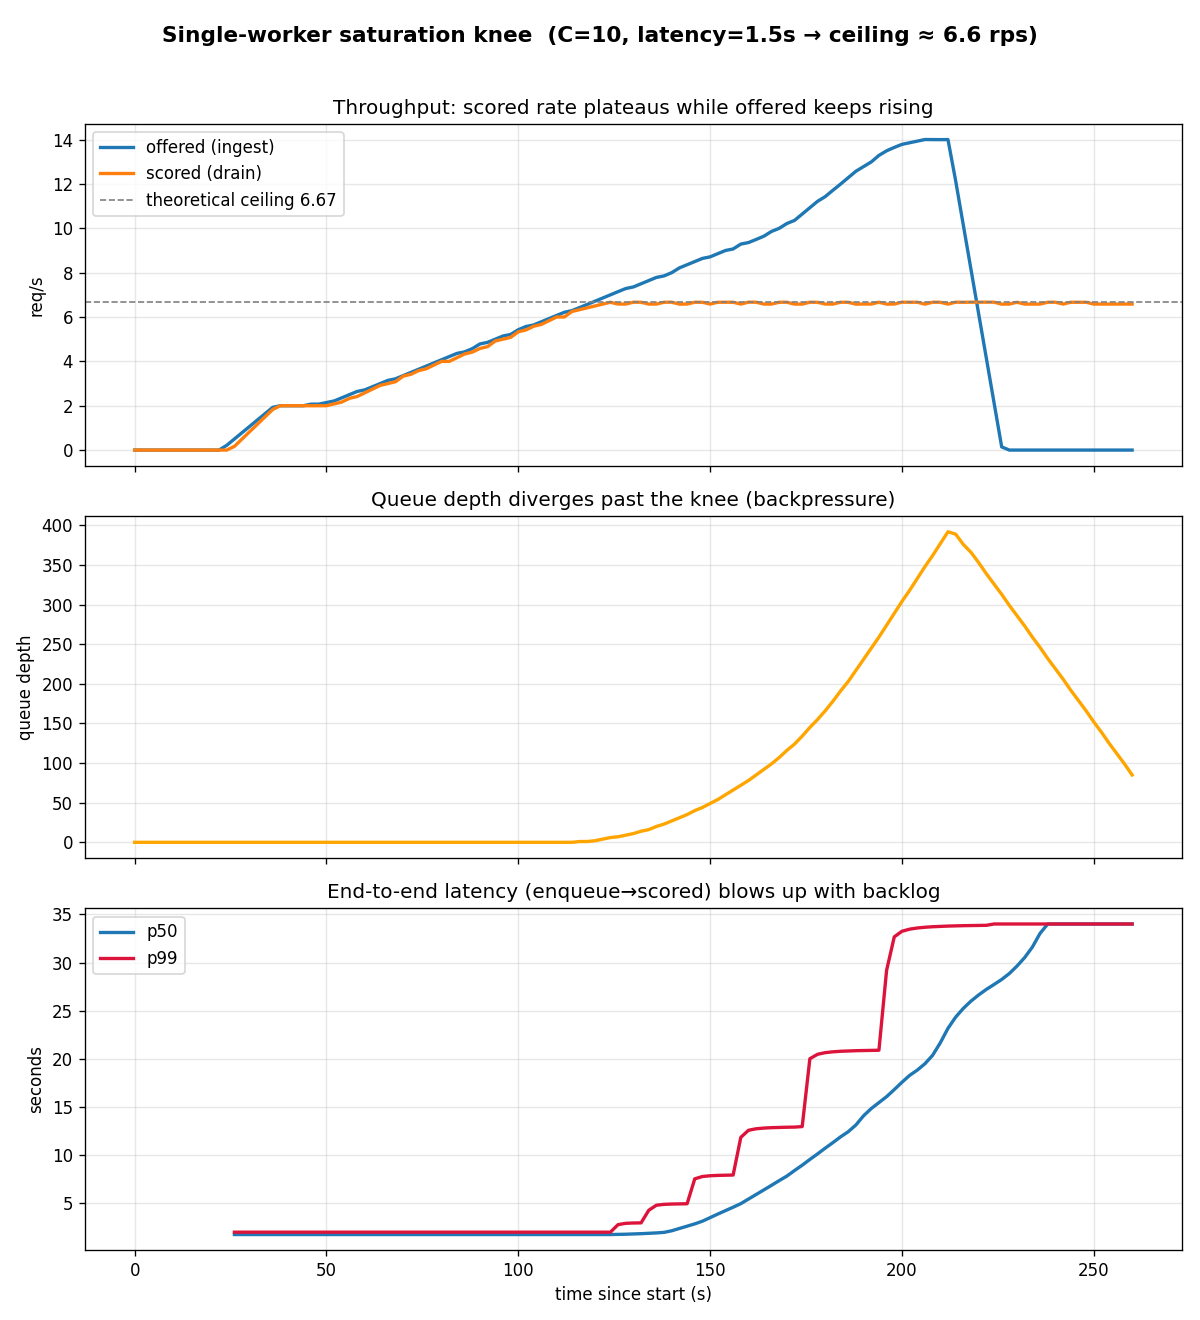
Up to about 6.6 requests per second the system keeps pace; past that the waiting line grows without bound and the slowest submit-to-scored time climbs from 2 seconds to 34 seconds.
Why it matters
same load, same momentScaling and the fix
four workers at 20 requests per second; only the database pool size changedRunning one worker, then four lifts throughput from 6.6 to about 26 requests per second, close to a straight line. The next limit is the database connection pool: each worker holds a connection for the whole 1.5 second score, so a pool smaller than the number of jobs at once starves them. Enlarging the pool alone recovered everything below.
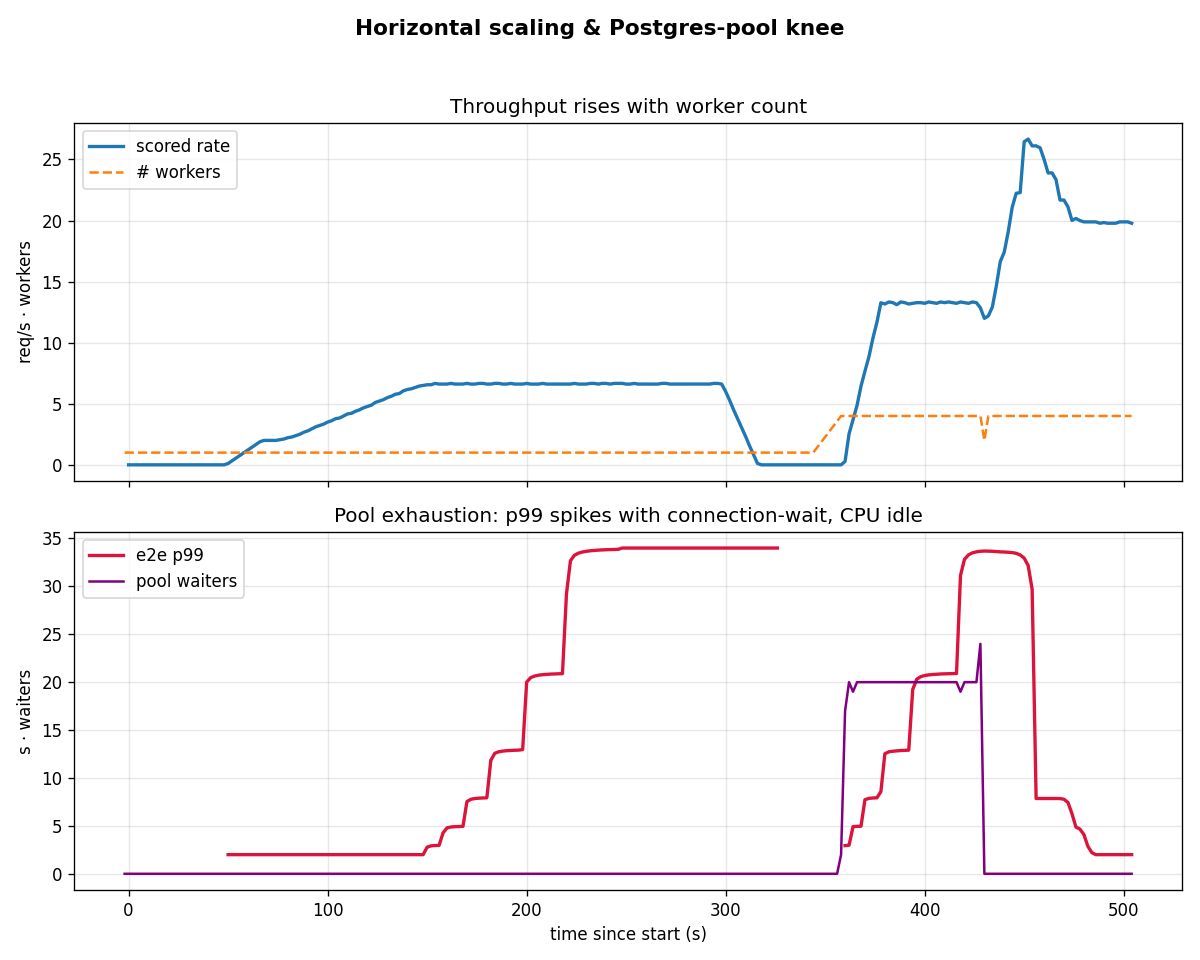
More workers raise throughput almost in a straight line, until too few database connections starve them; enlarging the pool clears the wait and cuts the slowest time about ten times.
Load versus response time
flat, then a sharp bend near 6.6 requests per second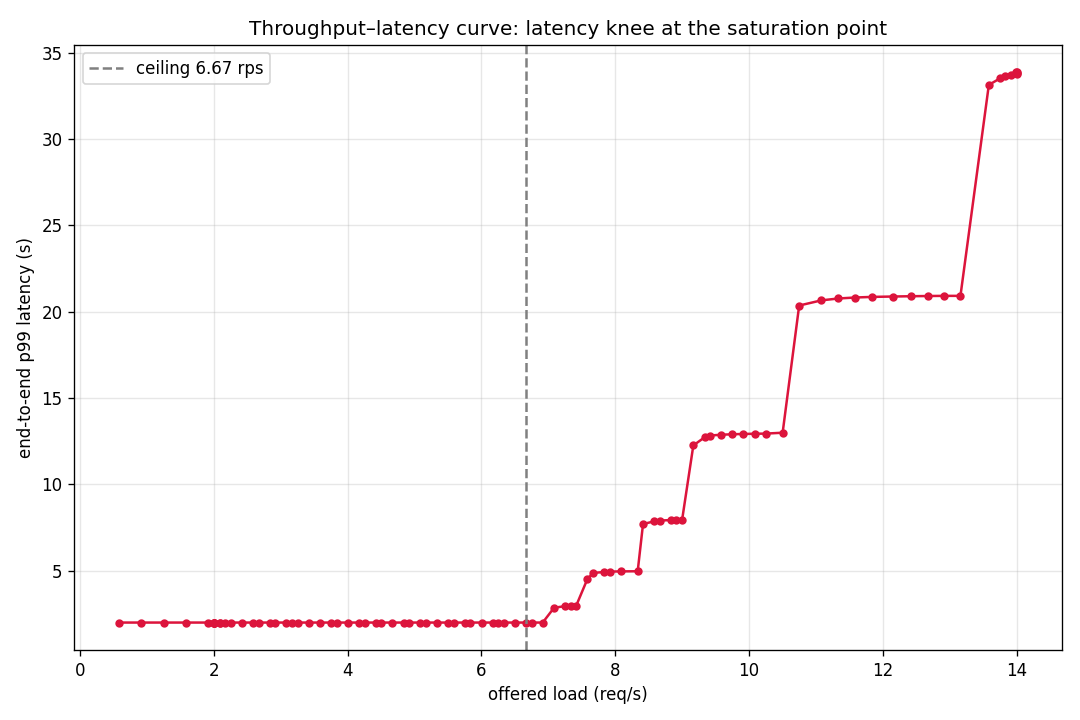
Response time stays flat until the saturation point near 6.6 requests per second, then rises sharply; that bend is the limit of the system as built.